Introduction to Python - Overview and Packages
rpi.analyticsdojo.com
1. Overview of Python Features#
Language Features
Python and Jupyter
Jupyter and Markdown
Python 2 vs Python 3
Python and Packages
2. Test#
one
2.1. Python Features#
Python has many of the same features of most programming languages.
Python is object oriented.
Python has buit in data types and functions that are included directly.
Python has an extensive ecosystem of packages (including ones for data science) available to extend the language to include new data types and functions.
2.2. Python is Interpreted#
Python is an interpreted language, in contrast to Java and C which are compiled languages.
This means we can type statements into the interpreter and they are executed immediately. This works well for data analytics because we can build things step by step.
2.2.1. Python and Jupyter#
Python commands can be executed in a Jupyter Notebook just by play at the end of a cell.
Blocks of cells or even the entire notebook can be executed by clicking on the Cell above.
The Kernal is responsible for interpreting the code, and the current kernal is listed on the top right of the notebook.
While Jupyter started as a Python project, there are now a variety of Kernals for different programming languages including R, Scala, and SAS.
Read more about Jupyter in the documentation here.
If a variable isn’t assigned it will be provided as output.
#No output is provided when assigning a variable.
g=5+5
[x for x in range(10000000000000)]
#No output is provided when assigning a variable.
g=5+5
#Just listing a variable will cause it to be provided as output.
g
10
2.2.2. Jupyter and Markdown#
Jupyter notebooks are a great way of documenting your analytics projects.
Select Cell->Cell Type->Markdown to create a Markdown Cell.
Check out this Markdown Cheatsheet.
Within code cells, you can comment by starting lines with
#.
#This is a Python Comment and won't generate output.
5+5
10
2.2.3. Python 2 vs Python 3#
Python went through some breaking changes when moving from Python 2 to Python 3, and it still causes difficulty in the community.
While we were stuck in Python 2 for a long time, Python 3 is increasingly.
We will be basing our learning on Python 3.X.
You can easily select the Python 2 kernal if you have to use it for a particular project.
You can view differences between Python 2 and Python 3 here.
# This Works with Python 2 but not Python 3 kernal. Change the Kernal to confirm.
print ('Hello, World!')
Hello, World!
# This Works with Python 2 and Python 3 kernal.
print ('Hello, World!')
Hello, World!
2.2.4. Python and Packages#
There are a tremendous number of packages available which extend the core capabilities of the Python language.
Packages are critical for data science, as data typically structured via external package.
The PyPI - the Python Package Index https://pypi.python.org provides search listing of all packages.
It is possible that packages could be avaialble for Python 2 but not Python 3 (or vice versa).
pipis an the package management system used to install and manage Python packages.Anaconda (
conda) is the package management system with enterprise packages available.

2.2.5. Python and Installing Packages#
When using Conda, the command
conda installpip is the package management system used to install and manage Python packages.
pip must be run on the terminal.
Two options for accessing shell of Docker container
(1) From a notebook:
!conda install -y matplotlib
!pip install matplotlib
(2) Select New->Terminal from main Jupyter screeen.
#Conda will work if running locally, but not on colab.
#!conda install -y matplotlib
#This will install the package matplotlib (or really check that it is installed because it is by default.)
!pip install  matplotlib
Requirement already satisfied: matplotlib in /Users/jasonkuruzovich/opt/anaconda3/lib/python3.9/site-packages (3.5.1)
Requirement already satisfied: fonttools>=4.22.0 in /Users/jasonkuruzovich/opt/anaconda3/lib/python3.9/site-packages (from matplotlib) (4.25.0)
Requirement already satisfied: pyparsing>=2.2.1 in /Users/jasonkuruzovich/opt/anaconda3/lib/python3.9/site-packages (from matplotlib) (3.0.4)
Requirement already satisfied: packaging>=20.0 in /Users/jasonkuruzovich/opt/anaconda3/lib/python3.9/site-packages (from matplotlib) (21.3)
Requirement already satisfied: numpy>=1.17 in /Users/jasonkuruzovich/opt/anaconda3/lib/python3.9/site-packages (from matplotlib) (1.21.5)
Requirement already satisfied: cycler>=0.10 in /Users/jasonkuruzovich/opt/anaconda3/lib/python3.9/site-packages (from matplotlib) (0.11.0)
Requirement already satisfied: python-dateutil>=2.7 in /Users/jasonkuruzovich/opt/anaconda3/lib/python3.9/site-packages (from matplotlib) (2.8.2)
Requirement already satisfied: kiwisolver>=1.0.1 in /Users/jasonkuruzovich/opt/anaconda3/lib/python3.9/site-packages (from matplotlib) (1.3.2)
Requirement already satisfied: pillow>=6.2.0 in /Users/jasonkuruzovich/opt/anaconda3/lib/python3.9/site-packages (from matplotlib) (9.0.1)
Requirement already satisfied: six>=1.5 in /Users/jasonkuruzovich/opt/anaconda3/lib/python3.9/site-packages (from python-dateutil>=2.7->matplotlib) (1.16.0)
2.2.6. Python and Using Packages#
Python packages must be imported before using.
Python packages are organized as modules, and you can import the entire package or just the submodule that you need.
Packages only have to be imported once in a notebook (not in every cell).
Multipled ways of importing all or specific modules (that impact how you call methods)
(1) Import all of the package
import matplotlib(2) Import a module
import matplotlib.pyplotorfrom matplotlib import pyplot(3) Import all of some of package with abbreviation
import matplotlib.pyplot as plt
#This is required to show plots. It just has to be run once.
%matplotlib inline
#This will import the pyplot module of the matplotlab package.
import matplotlib.pyplot as pyplot
#Observe how we are calling the plot method within the pyplot module.
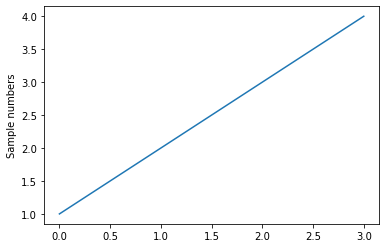
pyplot.plot([1,2,3,4])
pyplot.ylabel('Sample numbers')
pyplot.show()

#This will import just the pyplot module as plt
import matplotlib.pyplot as plt
#Observe how we are calling the plot method within the pyplot module.
plt.plot([1,2,3,4])
pyplot.ylabel('Sample numbers')
plt.show()


