MA, AR, and Arma
introml.analyticsdojo.com
60. MA, AR, and Arma#
import pandas as pd
import numpy as np
import matplotlib.pyplot as plt
from matplotlib.pylab import rcParams
rcParams['figure.figsize'] = 15, 5
import seaborn as sns
!pip -q install yfinance
import yfinance as yf
####Moving Average analysis
FB = yf.Ticker("META")
# get historical market data
FB_values = FB.history(start="2020-06-01")
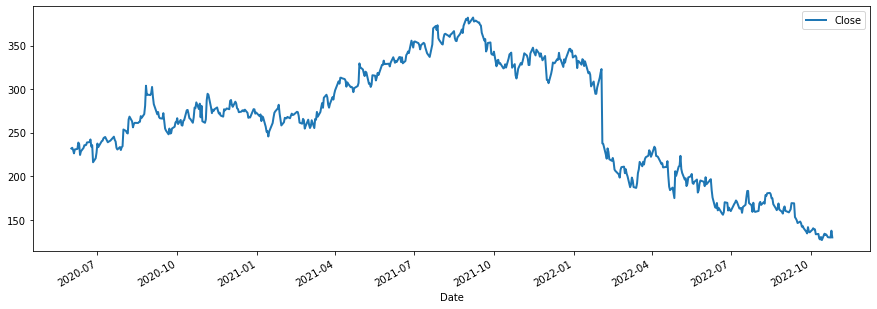
FB_values[['Close']].plot(lw=2)
<AxesSubplot:xlabel='Date'>
#Rolling average
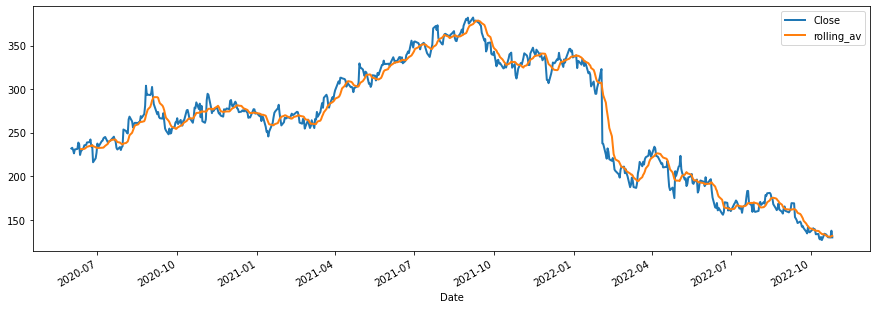
FB_values['rolling_av'] = FB_values['Close'].rolling(10).mean()
# take a look
FB_values[['Close','rolling_av']].plot(lw=2)
<AxesSubplot:xlabel='Date'>
from statsmodels.tsa.arima.model import ARIMA
ARMA_model = ARIMA(endog=FB_values['Close'], order=(0, 0, 10))
results = ARMA_model.fit()
print(results.summary())
/opt/anaconda3/lib/python3.8/site-packages/statsmodels/tsa/base/tsa_model.py:581: ValueWarning: A date index has been provided, but it has no associated frequency information and so will be ignored when e.g. forecasting.
  warnings.warn('A date index has been provided, but it has no'
/opt/anaconda3/lib/python3.8/site-packages/statsmodels/tsa/base/tsa_model.py:581: ValueWarning: A date index has been provided, but it has no associated frequency information and so will be ignored when e.g. forecasting.
  warnings.warn('A date index has been provided, but it has no'
/opt/anaconda3/lib/python3.8/site-packages/statsmodels/tsa/base/tsa_model.py:581: ValueWarning: A date index has been provided, but it has no associated frequency information and so will be ignored when e.g. forecasting.
  warnings.warn('A date index has been provided, but it has no'
/opt/anaconda3/lib/python3.8/site-packages/statsmodels/tsa/statespace/sarimax.py:978: UserWarning: Non-invertible starting MA parameters found. Using zeros as starting parameters.
  warn('Non-invertible starting MA parameters found.'
                               SARIMAX Results
==============================================================================
Dep. Variable:                  Close   No. Observations:                  608
Model:                ARIMA(0, 0, 10)   Log Likelihood               -2709.211
Date:                Wed, 26 Oct 2022   AIC                           5442.423
Time:                        19:26:34   BIC                           5495.345
Sample:                             0   HQIC                          5463.012
                                - 608
Covariance Type:                  opg
==============================================================================
                 coef    std err          z      P>|z|      [0.025      0.975]
------------------------------------------------------------------------------
const        263.6635      7.284     36.199      0.000     249.388     277.939
ma.L1          0.7786      0.019     40.264      0.000       0.741       0.817
ma.L2          0.3297      0.013     24.505      0.000       0.303       0.356
ma.L3          0.1467      0.011     12.936      0.000       0.125       0.169
ma.L4          0.9416      0.011     87.808      0.000       0.921       0.963
ma.L5          1.0996      0.019     59.397      0.000       1.063       1.136
ma.L6          0.8785      0.020     44.231      0.000       0.840       0.917
ma.L7          0.1297      0.013     10.040      0.000       0.104       0.155
ma.L8          0.3853      0.013     29.529      0.000       0.360       0.411
ma.L9          0.8021      0.015     53.684      0.000       0.773       0.831
ma.L10         0.8761      0.019     46.821      0.000       0.839       0.913
sigma2       439.7564     29.343     14.987      0.000     382.245     497.268
===================================================================================
Ljung-Box (L1) (Q):                 224.32   Jarque-Bera (JB):                19.29
Prob(Q):                              0.00   Prob(JB):                         0.00
Heteroskedasticity (H):               6.97   Skew:                            -0.39
Prob(H) (two-sided):                  0.00   Kurtosis:                         3.40
===================================================================================

Warnings:
[1] Covariance matrix calculated using the outer product of gradients (complex-step).
/opt/anaconda3/lib/python3.8/site-packages/statsmodels/base/model.py:566: ConvergenceWarning: Maximum Likelihood optimization failed to converge. Check mle_retvals
  warnings.warn("Maximum Likelihood optimization failed to "
start_date = '2020-06-12'
end_date   = '2022-10-04'
FB_values['forecast_Ma'] = results.predict(start=start_date, end=end_date)
FB_values[['Close','rolling_av','forecast_Ma']].plot(lw=2)
<AxesSubplot:xlabel='Date'>
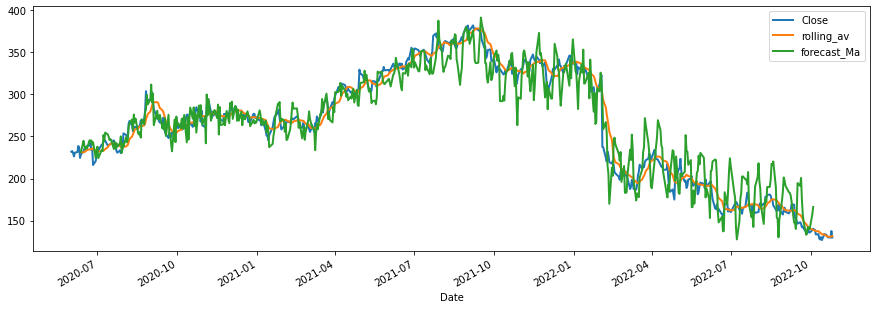
# A Mojaor flaw is that the time series may not be stationary. It has to be done on returns
####Auto Regressive analysis
ARMA_model = ARIMA(endog=FB_values['Close'], order=(10, 0,0))
results = ARMA_model.fit()
print(results.summary())
/opt/anaconda3/lib/python3.8/site-packages/statsmodels/tsa/base/tsa_model.py:581: ValueWarning: A date index has been provided, but it has no associated frequency information and so will be ignored when e.g. forecasting.
  warnings.warn('A date index has been provided, but it has no'
/opt/anaconda3/lib/python3.8/site-packages/statsmodels/tsa/base/tsa_model.py:581: ValueWarning: A date index has been provided, but it has no associated frequency information and so will be ignored when e.g. forecasting.
  warnings.warn('A date index has been provided, but it has no'
/opt/anaconda3/lib/python3.8/site-packages/statsmodels/tsa/base/tsa_model.py:581: ValueWarning: A date index has been provided, but it has no associated frequency information and so will be ignored when e.g. forecasting.
  warnings.warn('A date index has been provided, but it has no'
                               SARIMAX Results
==============================================================================
Dep. Variable:                  Close   No. Observations:                  608
Model:                ARIMA(10, 0, 0)   Log Likelihood               -2051.121
Date:                Wed, 26 Oct 2022   AIC                           4126.243
Time:                        19:26:35   BIC                           4179.165
Sample:                             0   HQIC                          4146.832
                                - 608
Covariance Type:                  opg
==============================================================================
                 coef    std err          z      P>|z|      [0.025      0.975]
------------------------------------------------------------------------------
const        263.6740    509.998      0.517      0.605    -735.904    1263.252
ar.L1          0.9530      0.050     18.994      0.000       0.855       1.051
ar.L2          0.0623      0.062      1.004      0.315      -0.059       0.184
ar.L3         -0.1102      0.053     -2.090      0.037      -0.214      -0.007
ar.L4          0.0396      0.051      0.768      0.442      -0.061       0.140
ar.L5          0.0193      0.054      0.355      0.722      -0.087       0.126
ar.L6          0.0225      0.056      0.399      0.690      -0.088       0.133
ar.L7         -0.0239      0.057     -0.422      0.673      -0.135       0.087
ar.L8          0.0016      0.070      0.022      0.982      -0.136       0.139
ar.L9          0.0922      0.076      1.211      0.226      -0.057       0.242
ar.L10        -0.0570      0.053     -1.072      0.284      -0.161       0.047
sigma2        49.3269      1.286     38.352      0.000      46.806      51.848
===================================================================================
Ljung-Box (L1) (Q):                   0.00   Jarque-Bera (JB):             26048.16
Prob(Q):                              0.96   Prob(JB):                         0.00
Heteroskedasticity (H):               2.02   Skew:                            -2.53
Prob(H) (two-sided):                  0.00   Kurtosis:                        34.66
===================================================================================

Warnings:
[1] Covariance matrix calculated using the outer product of gradients (complex-step).
start_date = '2020-06-12'
end_date   = '2022-10-04'
FB_values['forecast_Ar'] = results.predict(start=start_date, end=end_date)
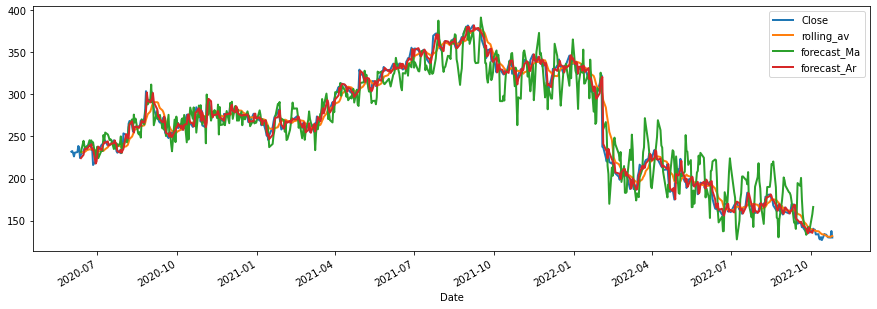
FB_values[['Close','rolling_av','forecast_Ma','forecast_Ar']].plot(lw=2)
<AxesSubplot:xlabel='Date'>
####Now lets do AR & MA
ARMA_model = ARIMA(endog=FB_values['Close'], order=(10, 0,10))
results = ARMA_model.fit()
print(results.summary())
/opt/anaconda3/lib/python3.8/site-packages/statsmodels/tsa/base/tsa_model.py:581: ValueWarning: A date index has been provided, but it has no associated frequency information and so will be ignored when e.g. forecasting.
  warnings.warn('A date index has been provided, but it has no'
/opt/anaconda3/lib/python3.8/site-packages/statsmodels/tsa/base/tsa_model.py:581: ValueWarning: A date index has been provided, but it has no associated frequency information and so will be ignored when e.g. forecasting.
  warnings.warn('A date index has been provided, but it has no'
/opt/anaconda3/lib/python3.8/site-packages/statsmodels/tsa/base/tsa_model.py:581: ValueWarning: A date index has been provided, but it has no associated frequency information and so will be ignored when e.g. forecasting.
  warnings.warn('A date index has been provided, but it has no'
/opt/anaconda3/lib/python3.8/site-packages/statsmodels/tsa/statespace/sarimax.py:966: UserWarning: Non-stationary starting autoregressive parameters found. Using zeros as starting parameters.
  warn('Non-stationary starting autoregressive parameters'
                               SARIMAX Results
==============================================================================
Dep. Variable:                  Close   No. Observations:                  608
Model:               ARIMA(10, 0, 10)   Log Likelihood               -2048.853
Date:                Wed, 26 Oct 2022   AIC                           4141.706
Time:                        19:26:37   BIC                           4238.730
Sample:                             0   HQIC                          4179.453
                                - 608
Covariance Type:                  opg
==============================================================================
                 coef    std err          z      P>|z|      [0.025      0.975]
------------------------------------------------------------------------------
const        263.6608     77.496      3.402      0.001     111.771     415.551
ar.L1          0.3242     10.387      0.031      0.975     -20.035      20.683
ar.L2          0.6924      8.735      0.079      0.937     -16.428      17.813
ar.L3         -0.0474      2.440     -0.019      0.985      -4.830       4.735
ar.L4         -0.4487      1.723     -0.260      0.795      -3.826       2.929
ar.L5          0.0365      3.563      0.010      0.992      -6.946       7.019
ar.L6          0.3317      2.301      0.144      0.885      -4.179       4.842
ar.L7         -0.1589      2.141     -0.074      0.941      -4.355       4.037
ar.L8         -0.4674      2.951     -0.158      0.874      -6.252       5.317
ar.L9          0.4247      3.224      0.132      0.895      -5.893       6.743
ar.L10         0.2979      6.117      0.049      0.961     -11.692      12.288
ma.L1          0.6286     10.385      0.061      0.952     -19.726      20.984
ma.L2         -0.0274      1.333     -0.021      0.984      -2.639       2.585
ma.L3         -0.0354      0.766     -0.046      0.963      -1.537       1.466
ma.L4          0.3989      0.523      0.762      0.446      -0.627       1.424
ma.L5          0.4050      3.963      0.102      0.919      -7.362       8.172
ma.L6          0.1198      2.022      0.059      0.953      -3.844       4.083
ma.L7          0.2405      0.631      0.381      0.703      -0.997       1.478
ma.L8          0.6664      2.667      0.250      0.803      -4.561       5.893
ma.L9          0.3085      5.696      0.054      0.957     -10.855      11.472
ma.L10         0.0216      0.318      0.068      0.946      -0.601       0.645
sigma2        49.3105      1.759     28.029      0.000      45.862      52.759
===================================================================================
Ljung-Box (L1) (Q):                   0.00   Jarque-Bera (JB):             25080.34
Prob(Q):                              0.97   Prob(JB):                         0.00
Heteroskedasticity (H):               1.99   Skew:                            -2.45
Prob(H) (two-sided):                  0.00   Kurtosis:                        34.08
===================================================================================

Warnings:
[1] Covariance matrix calculated using the outer product of gradients (complex-step).
/opt/anaconda3/lib/python3.8/site-packages/statsmodels/base/model.py:566: ConvergenceWarning: Maximum Likelihood optimization failed to converge. Check mle_retvals
  warnings.warn("Maximum Likelihood optimization failed to "
start_date = '2020-06-12'
end_date   = '2022-10-04'
FB_values['forecast_ArMA'] = results.predict(start=start_date, end=end_date)
plt.rcParams["figure.figsize"] = (15,10)
sns.set(font_scale=2)
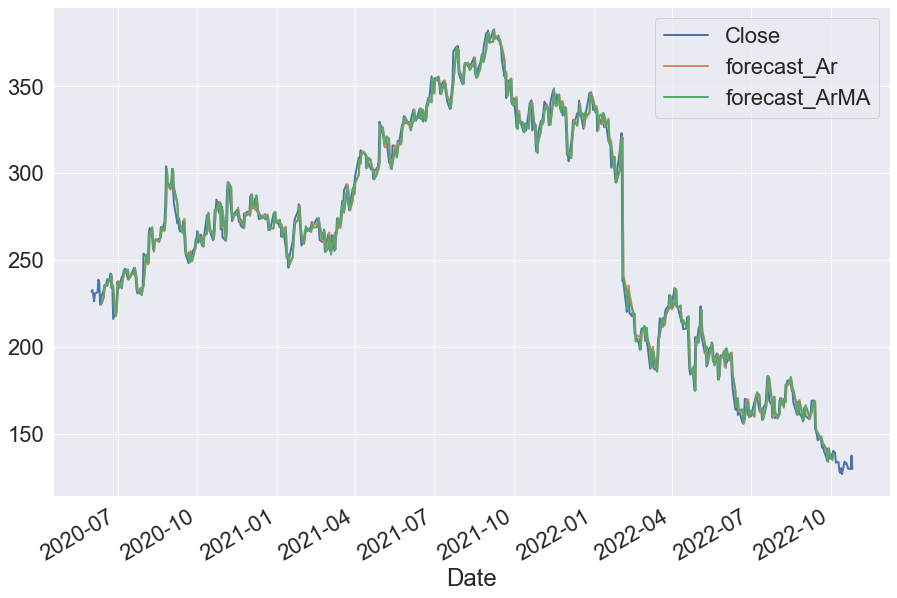
FB_values[['Close','forecast_Ar','forecast_ArMA']].plot(lw=2)
<AxesSubplot:xlabel='Date'>
