MA, AR, and Arma
introml.analyticsdojo.com
61. Out of Sample Prediction#
import pandas as pd
import numpy as np
import matplotlib.pyplot as plt
from matplotlib.pylab import rcParams
rcParams['figure.figsize'] = 15, 5
import seaborn as sns
#!pip -q install yfinance
import yfinance as yf
sns.set(font_scale=2)
FB = yf.Ticker("META")
FB_values = FB.history(start="2020-06-01")
train_values=FB_values[:len(FB_values)-1000]
test_values=FB_values[len(FB_values)-1000:]


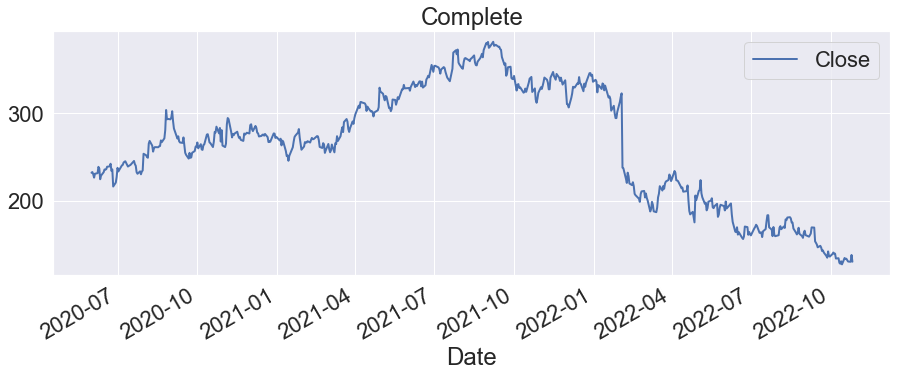
FB_values[['Close']].plot(lw=2,title='Complete')
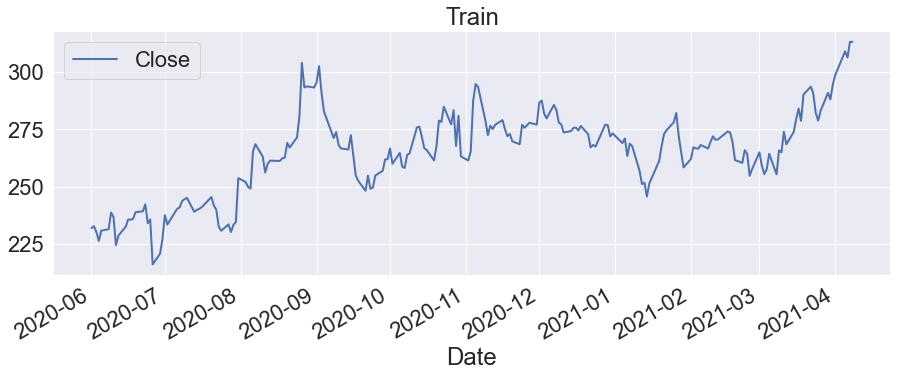
train_values[['Close']].plot(lw=2,title='Train')
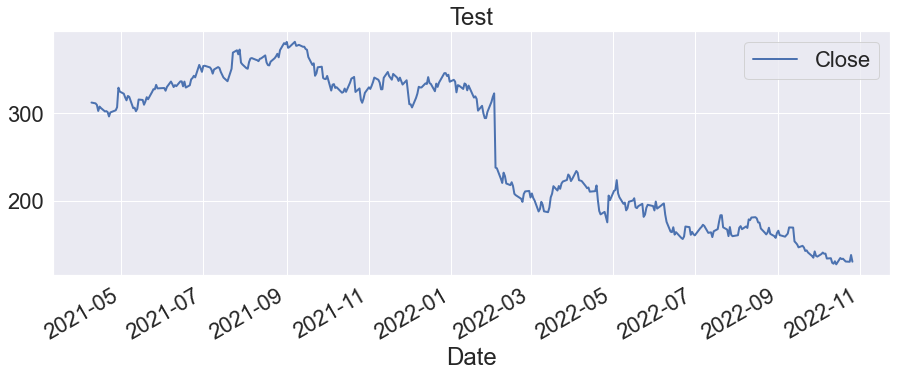
test_values[['Close']].plot(lw=2,title='Test')
<AxesSubplot:title={'center':'Test'}, xlabel='Date'>


from statsmodels.tsa.arima.model import ARIMA
ARMA_model = ARIMA(endog=train_values['Close'], order=(10, 0, 10))
results = ARMA_model.fit()
print(results.summary())
/opt/anaconda3/lib/python3.8/site-packages/statsmodels/tsa/base/tsa_model.py:581: ValueWarning: A date index has been provided, but it has no associated frequency information and so will be ignored when e.g. forecasting.
  warnings.warn('A date index has been provided, but it has no'
/opt/anaconda3/lib/python3.8/site-packages/statsmodels/tsa/base/tsa_model.py:581: ValueWarning: A date index has been provided, but it has no associated frequency information and so will be ignored when e.g. forecasting.
  warnings.warn('A date index has been provided, but it has no'
/opt/anaconda3/lib/python3.8/site-packages/statsmodels/tsa/base/tsa_model.py:581: ValueWarning: A date index has been provided, but it has no associated frequency information and so will be ignored when e.g. forecasting.
  warnings.warn('A date index has been provided, but it has no'
/opt/anaconda3/lib/python3.8/site-packages/statsmodels/tsa/statespace/sarimax.py:978: UserWarning: Non-invertible starting MA parameters found. Using zeros as starting parameters.
  warn('Non-invertible starting MA parameters found.'
                               SARIMAX Results
==============================================================================
Dep. Variable:                  Close   No. Observations:                  216
Model:               ARIMA(10, 0, 10)   Log Likelihood                -681.035
Date:                Wed, 26 Oct 2022   AIC                           1406.071
Time:                        20:01:06   BIC                           1480.327
Sample:                             0   HQIC                          1436.071
                                - 216
Covariance Type:                  opg
==============================================================================
                 coef    std err          z      P>|z|      [0.025      0.975]
------------------------------------------------------------------------------
const        264.4526     28.232      9.367      0.000     209.118     319.787
ar.L1          0.5871      1.666      0.352      0.724      -2.678       3.852
ar.L2          0.8793      0.858      1.024      0.306      -0.803       2.562
ar.L3         -1.2841      1.268     -1.013      0.311      -3.769       1.201
ar.L4          0.4175      2.047      0.204      0.838      -3.595       4.430
ar.L5          0.9243      0.893      1.035      0.301      -0.827       2.675
ar.L6         -1.2504      1.344     -0.930      0.352      -3.885       1.384
ar.L7          0.2804      1.940      0.145      0.885      -3.522       4.082
ar.L8          0.8848      0.699      1.265      0.206      -0.486       2.255
ar.L9         -0.2810      1.278     -0.220      0.826      -2.785       2.223
ar.L10        -0.1738      0.550     -0.316      0.752      -1.251       0.904
ma.L1          0.5007      1.674      0.299      0.765      -2.781       3.783
ma.L2         -0.4955      1.219     -0.407      0.684      -2.884       1.893
ma.L3          0.5515      0.585      0.943      0.346      -0.595       1.698
ma.L4          0.5197      1.248      0.417      0.677      -1.926       2.965
ma.L5         -0.6316      1.142     -0.553      0.580      -2.871       1.607
ma.L6          0.3860      0.726      0.531      0.595      -1.038       1.810
ma.L7          0.5651      0.855      0.661      0.509      -1.111       2.241
ma.L8         -0.4679      1.079     -0.434      0.665      -2.583       1.647
ma.L9         -0.3629      0.618     -0.587      0.557      -1.575       0.849
ma.L10         0.0409      0.399      0.102      0.918      -0.742       0.824
sigma2        30.4260      3.419      8.898      0.000      23.724      37.128
===================================================================================
Ljung-Box (L1) (Q):                   0.18   Jarque-Bera (JB):                 5.18
Prob(Q):                              0.67   Prob(JB):                         0.07
Heteroskedasticity (H):               0.85   Skew:                            -0.09
Prob(H) (two-sided):                  0.49   Kurtosis:                         3.74
===================================================================================

Warnings:
[1] Covariance matrix calculated using the outer product of gradients (complex-step).
/opt/anaconda3/lib/python3.8/site-packages/statsmodels/base/model.py:566: ConvergenceWarning: Maximum Likelihood optimization failed to converge. Check mle_retvals
  warnings.warn("Maximum Likelihood optimization failed to "
# evaluate an ARIMA model using a walk-forward validation
from pandas import read_csv
from pandas import datetime
from matplotlib import pyplot
from statsmodels.tsa.arima.model import ARIMA
from sklearn.metrics import mean_squared_error
from math import sqrt
# load dataset

FB_values = FB.history(start="2020-06-01")
train_values=FB_values[:len(FB_values)-1000]
test_values=FB_values[len(FB_values)-1000:]


test_values=test_values['Close']
train_values=train_values['Close']
history = [x for x in train_values]

history
# split into train and test sets
predictions = list()

# walk-forward validation
for t in range(len(test_values)):
    model = ARIMA(history, order=(1,0,1))
    model_fit = model.fit()
    output = model_fit.forecast(steps=1)
    yhat = output[0]
    predictions.append(yhat)
    obs = test_values[t]
    history.append(obs)
    #print('predicted=%f, expected=%f' % (yhat, obs))
# evaluate forecasts
rmse = sqrt(mean_squared_error(test_values, predictions))
print('Test RMSE: %.3f' % rmse)
<ipython-input-4-f5b348368ee8>:3: FutureWarning: The pandas.datetime class is deprecated and will be removed from pandas in a future version. Import from datetime module instead.
  from pandas import datetime
Test RMSE: 7.590
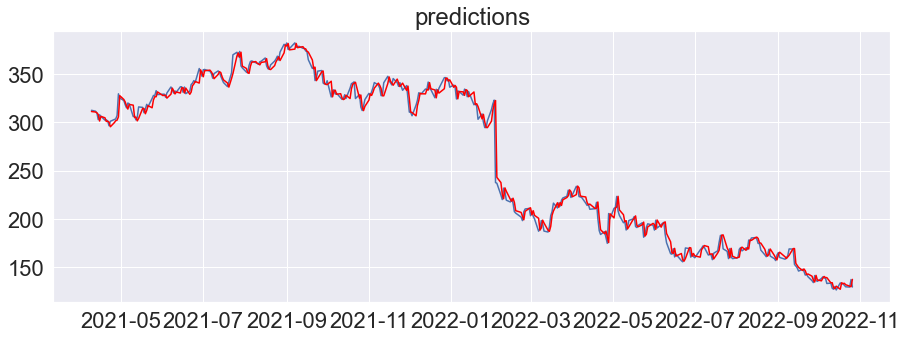
# plot forecasts against actual outcomes
predictions=pd.DataFrame(predictions)
test_values=pd.DataFrame(test_values)
predictions.index=test_values.index
pyplot.plot(test_values)
plt.title("predictions")
pyplot.plot(predictions, color='red')
pyplot.show()


