Titanic PCA
introml.analyticsdojo.com
30. Titanic PCA#
As an example of how to work with both categorical and numerical data, we will perform survival predicition for the passengers of the HMS Titanic.
import os
import pandas as pd
train = pd.read_csv('https://raw.githubusercontent.com/rpi-techfundamentals/spring2019-materials/master/input/train.csv')
test = pd.read_csv('https://raw.githubusercontent.com/rpi-techfundamentals/spring2019-materials/master/input/test.csv')

print(train.columns, test.columns)
Index(['PassengerId', 'Survived', 'Pclass', 'Name', 'Sex', 'Age', 'SibSp',
       'Parch', 'Ticket', 'Fare', 'Cabin', 'Embarked'],
      dtype='object') Index(['PassengerId', 'Pclass', 'Name', 'Sex', 'Age', 'SibSp', 'Parch',
       'Ticket', 'Fare', 'Cabin', 'Embarked'],
      dtype='object')
Here is a broad description of the keys and what they mean:
pclass          Passenger Class
                (1 = 1st; 2 = 2nd; 3 = 3rd)
survival        Survival
                (0 = No; 1 = Yes)
name            Name
sex             Sex
age             Age
sibsp           Number of Siblings/Spouses Aboard
parch           Number of Parents/Children Aboard
ticket          Ticket Number
fare            Passenger Fare
cabin           Cabin
embarked        Port of Embarkation
                (C = Cherbourg; Q = Queenstown; S = Southampton)
boat            Lifeboat
body            Body Identification Number
home.dest       Home/Destination
In general, it looks like name, sex, cabin, embarked, boat, body, and homedest may be candidates for categorical features, while the rest appear to be numerical features. We can also look at the first couple of rows in the dataset to get a better understanding:
train.head()
| PassengerId | Survived | Pclass | Name | Sex | Age | SibSp | Parch | Ticket | Fare | Cabin | Embarked | |
|---|---|---|---|---|---|---|---|---|---|---|---|---|
| 0 | 1 | 0 | 3 | Braund, Mr. Owen Harris | male | 22.0 | 1 | 0 | A/5 21171 | 7.2500 | NaN | S |
| 1 | 2 | 1 | 1 | Cumings, Mrs. John Bradley (Florence Briggs Th... | female | 38.0 | 1 | 0 | PC 17599 | 71.2833 | C85 | C |
| 2 | 3 | 1 | 3 | Heikkinen, Miss. Laina | female | 26.0 | 0 | 0 | STON/O2. 3101282 | 7.9250 | NaN | S |
| 3 | 4 | 1 | 1 | Futrelle, Mrs. Jacques Heath (Lily May Peel) | female | 35.0 | 1 | 0 | 113803 | 53.1000 | C123 | S |
| 4 | 5 | 0 | 3 | Allen, Mr. William Henry | male | 35.0 | 0 | 0 | 373450 | 8.0500 | NaN | S |
30.1. Preprocessing function#
We want to create a preprocessing function that can address transformation of our train and test set.
from sklearn.impute import SimpleImputer
import numpy as np

cat_features = ['Pclass', 'Sex', 'Embarked']
num_features =  [ 'Age', 'SibSp', 'Parch', 'Fare'  ]


def preprocess(df, num_features, cat_features, dv):
    features = cat_features + num_features
    if dv in df.columns:
      y = df[dv]
    else:
      y=None
    #Address missing variables
    print("Total missing values before processing:", df[features].isna().sum().sum() )

    imp_mode = SimpleImputer(missing_values=np.nan, strategy='most_frequent')
    df[cat_features]=imp_mode.fit_transform(df[cat_features] )
    imp_mean = SimpleImputer(missing_values=np.nan, strategy='mean')
    df[num_features]=imp_mean.fit_transform(df[num_features])
    print("Total missing values after processing:", df[features].isna().sum().sum() )

    X = pd.get_dummies(df[features], columns=cat_features, drop_first=True)
    return y,X

y, X =  preprocess(train, num_features, cat_features, 'Survived')
test_y, test_X = preprocess(test, num_features, cat_features, 'Survived')
Total missing values before processing: 179
Total missing values after processing: 0
Total missing values before processing: 87
Total missing values after processing: 0
31. PCA Analysis#
See Documentation.
You can incorporate PCA based on number of components or the variance explained.
from sklearn.decomposition import PCA
pca = PCA(n_components=5)
pca.fit(X)
X2=pca.transform(X)
#This indicates the amount of variance explained by each of the principal components.
print(pca.explained_variance_)
[2.47107661e+03 1.67651481e+02 1.25165106e+00 4.73653673e-01
 3.18808533e-01]
from sklearn.decomposition import PCA
pca2 = PCA(n_components=0.97)
pca2.fit(X)
X3=pca2.transform(X)
print(pca2.explained_variance_)
[2471.07660618 167.65148116]
cov_data = np.corrcoef(X3.T)
cov_data
array([[1.00000000e+00, 1.90521771e-16],
       [1.90521771e-16, 1.00000000e+00]])
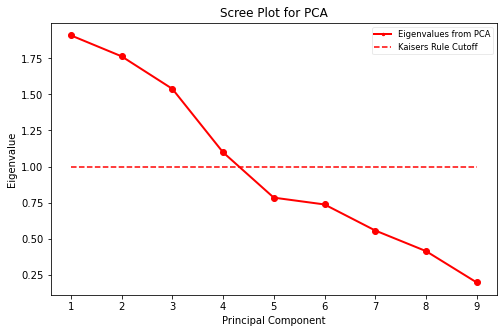
31.1. Elbow Plot and Kaisers Rule Cutoff#
Here is a link to documentation of Kaisers Rule.
from factor_analyzer import FactorAnalyzer
from factor_analyzer.factor_analyzer import calculate_bartlett_sphericity
from sklearn.decomposition import PCA
import matplotlib.pyplot as plt
import matplotlib
def scree_plot(eigvals):
    fig = plt.figure(figsize=(8,5))
    sing_vals = np.arange(len(eigvals)) + 1
    plt.plot(sing_vals, eigvals, 'ro-', linewidth=2)
    #####horizontal line
    horiz_line_data = np.array([1 for i in range(len(sing_vals))])
    plt.plot(sing_vals, horiz_line_data, 'r--')
    plt.title('Scree Plot for PCA')
    plt.xlabel('Principal Component')
    plt.ylabel('Eigenvalue')
    #I don't like the default legend so I typically make mine like below, e.g.
    #with smaller fonts and a bit transparent so I do not cover up data, and make
    #it moveable by the viewer in case upper-right is a bad place for it
    leg = plt.legend(['Eigenvalues from PCA', 'Kaisers Rule Cutoff'], loc='best', borderpad=0.3,
                     shadow=False, prop=matplotlib.font_manager.FontProperties(size='small'),
                     markerscale=0.4)
    leg.get_frame().set_alpha(0.4)

    #plt.savefig(os.path.join(save_dir / (name +'.jpg')))
    return plt

def pca_workflow(X, factors=-1, standardize=False, rotation='quartimax'):
    """
    This will perform factor analysis, calculating the number of factors.
    Printing scree plots, etc.
    """

    chi_square_value,p_value=calculate_bartlett_sphericity(X)

    if round(p_value,2)<=0.05:
        print("Data passed Bartlett’s test for sphericity.")
    else:
        print("Data failed Bartlett’s test for sphericity, use PCA with caution.")

    #This is used to calculate
    if factors ==-1:
        fa = FactorAnalyzer(n_factors=X.shape[1], rotation=None, method='ml')
        fa.fit_transform(X)
        # Check Eigenvalues
        ev, v = fa.get_eigenvalues()
        #set the number of factors as where Eigenvalue > 1.0
        factors = np.sum(ev>1.0)
    print ("Performing PCA  using rotation:", rotation, " factors: ", factors, "and standardization: ", standardize)
    loading_cols=['F'+str(x+1) for x in range(factors)]
    plot=scree_plot(ev)

    if standardize:
        X = StandardScaler().fit_transform(X)

    fa = FactorAnalyzer(n_factors=factors, method='principal', rotation=rotation)
    fa.fit(X)

    #Change it back to a dataframe.
    results=pd.DataFrame(fa.transform(X),columns=loading_cols)

    return results

X4= pca_workflow(X)
Data passed Bartlett’s test for sphericity.
Performing PCA  using rotation: quartimax  factors:  4 and standardization:  False

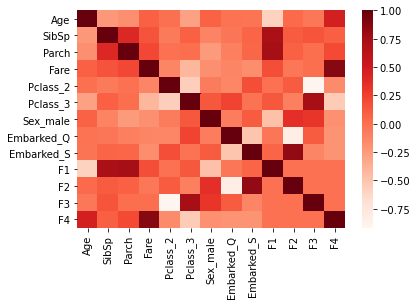
X4ALL = pd.concat([X,X4], axis =1)

import seaborn as sb
corr = X4ALL.corr()
sb.heatmap(corr, cmap="Reds")
corr
| Age | SibSp | Parch | Fare | Pclass_2 | Pclass_3 | Sex_male | Embarked_Q | Embarked_S | F1 | F2 | F3 | F4 | |
|---|---|---|---|---|---|---|---|---|---|---|---|---|---|
| Age | 1.000000 | -0.232625 | -0.179191 | 0.091566 | 0.006589 | -0.281004 | 0.084153 | -0.013855 | -0.019336 | -5.866885e-01 | 3.811172e-02 | -3.979659e-02 | 4.697929e-01 |
| SibSp | -0.232625 | 1.000000 | 0.414838 | 0.159651 | -0.055932 | 0.092548 | -0.114631 | -0.026354 | 0.068734 | 7.266238e-01 | 1.159037e-01 | 1.523544e-01 | 9.665757e-02 |
| Parch | -0.179191 | 0.414838 | 1.000000 | 0.216225 | -0.000734 | 0.015790 | -0.245489 | -0.081228 | 0.060814 | 7.530177e-01 | 9.012244e-02 | 1.703344e-02 | 2.089974e-01 |
| Fare | 0.091566 | 0.159651 | 0.216225 | 1.000000 | -0.118557 | -0.413333 | -0.182333 | -0.117216 | -0.162184 | 1.894779e-01 | -3.740721e-02 | 1.871599e-02 | 8.756367e-01 |
| Pclass_2 | 0.006589 | -0.055932 | -0.000734 | -0.118557 | 1.000000 | -0.565210 | -0.064746 | -0.127301 | 0.189980 | 4.552872e-04 | 1.211537e-01 | -9.175741e-01 | -1.588046e-01 |
| Pclass_3 | -0.281004 | 0.092548 | 0.015790 | -0.413333 | -0.565210 | 1.000000 | 0.137143 | 0.237449 | -0.015104 | 1.356613e-01 | -8.931807e-02 | 7.454824e-01 | -5.398062e-01 |
| Sex_male | 0.084153 | -0.114631 | -0.245489 | -0.182333 | -0.064746 | 0.137143 | 1.000000 | -0.074115 | 0.119224 | -4.686491e-01 | 3.593321e-01 | 3.241968e-01 | -1.889437e-01 |
| Embarked_Q | -0.013855 | -0.026354 | -0.081228 | -0.117216 | -0.127301 | 0.237449 | -0.074115 | 1.000000 | -0.499421 | -3.289038e-02 | -8.285253e-01 | 1.156588e-01 | -2.081933e-01 |
| Embarked_S | -0.019336 | 0.068734 | 0.060814 | -0.162184 | 0.189980 | -0.015104 | 0.119224 | -0.499421 | 1.000000 | 6.820785e-02 | 8.340531e-01 | -1.170429e-01 | -2.047724e-01 |
| F1 | -0.586688 | 0.726624 | 0.753018 | 0.189478 | 0.000455 | 0.135661 | -0.468649 | -0.032890 | 0.068208 | 1.000000e+00 | -8.423241e-16 | -1.197446e-16 | 4.285137e-16 |
| F2 | 0.038112 | 0.115904 | 0.090122 | -0.037407 | 0.121154 | -0.089318 | 0.359332 | -0.828525 | 0.834053 | -8.423241e-16 | 1.000000e+00 | -1.106983e-15 | 4.455845e-16 |
| F3 | -0.039797 | 0.152354 | 0.017033 | 0.018716 | -0.917574 | 0.745482 | 0.324197 | 0.115659 | -0.117043 | -1.197446e-16 | -1.106983e-15 | 1.000000e+00 | -8.211414e-16 |
| F4 | 0.469793 | 0.096658 | 0.208997 | 0.875637 | -0.158805 | -0.539806 | -0.188944 | -0.208193 | -0.204772 | 4.285137e-16 | 4.455845e-16 | -8.211414e-16 | 1.000000e+00 |

31.2. Train Test Split#
Now we are ready to model. We are going to separate our Kaggle given data into a “Train” and a “Validation” set.
#Import Module
from sklearn.model_selection import train_test_split
train_X, val_X, train_y, val_y = train_test_split(X, y, train_size=0.7, test_size=0.3, random_state=122,stratify=y)
from sklearn.neural_network import MLPClassifier
from sklearn.neighbors import KNeighborsClassifier
from sklearn.svm import SVC
from sklearn.gaussian_process import GaussianProcessClassifier
from sklearn.gaussian_process.kernels import RBF
from sklearn.tree import DecisionTreeClassifier
from sklearn.ensemble import RandomForestClassifier, AdaBoostClassifier
from sklearn.naive_bayes import GaussianNB
from sklearn.discriminant_analysis import QuadraticDiscriminantAnalysis
from sklearn import metrics
from sklearn import tree
classifier = tree.DecisionTreeClassifier(max_depth=3)
#This fits the model object to the data.
classifier.fit(train_X[['Age','Sex_male']], train_y)
#This creates the prediction.
train_y_pred = classifier.predict(train_X[['Age','Sex_male']])
val_y_pred = classifier.predict(val_X[['Age','Sex_male']])
test['Survived'] = classifier.predict(test_X[['Age','Sex_male']])
print("Metrics score train: ", metrics.accuracy_score(train_y, train_y_pred) )
print("Metrics score validation: ", metrics.accuracy_score(val_y, val_y_pred) )
Metrics score train:  0.7929373996789727
Metrics score validation:  0.8134328358208955


