Time Series Analysis
introml.analyticsdojo.com
59. Time Series Analysis#
import numpy as np
import pandas as pd
import os
import yfinance as yf
import matplotlib.pyplot as plt
import seaborn as sns
from statsmodels.tsa.seasonal import seasonal_decompose
#!pip install yfinance
data =  yf.download(tickers="TSLA", start="2016-1-1",end="2021-12-31",progress=False)
data.head()
| Open | High | Low | Close | Adj Close | Volume | |
|---|---|---|---|---|---|---|
| Date | ||||||
| 2016-01-04 | 15.381333 | 15.425333 | 14.600000 | 14.894000 | 14.894000 | 102406500 |
| 2016-01-05 | 15.090667 | 15.126000 | 14.666667 | 14.895333 | 14.895333 | 47802000 |
| 2016-01-06 | 14.666667 | 14.670000 | 14.398667 | 14.602667 | 14.602667 | 56686500 |
| 2016-01-07 | 14.279333 | 14.562667 | 14.244667 | 14.376667 | 14.376667 | 53314500 |
| 2016-01-08 | 14.524000 | 14.696000 | 14.051333 | 14.066667 | 14.066667 | 54421500 |
plt.rcParams["figure.figsize"] = (15,10)
sns.set(font_scale=3)
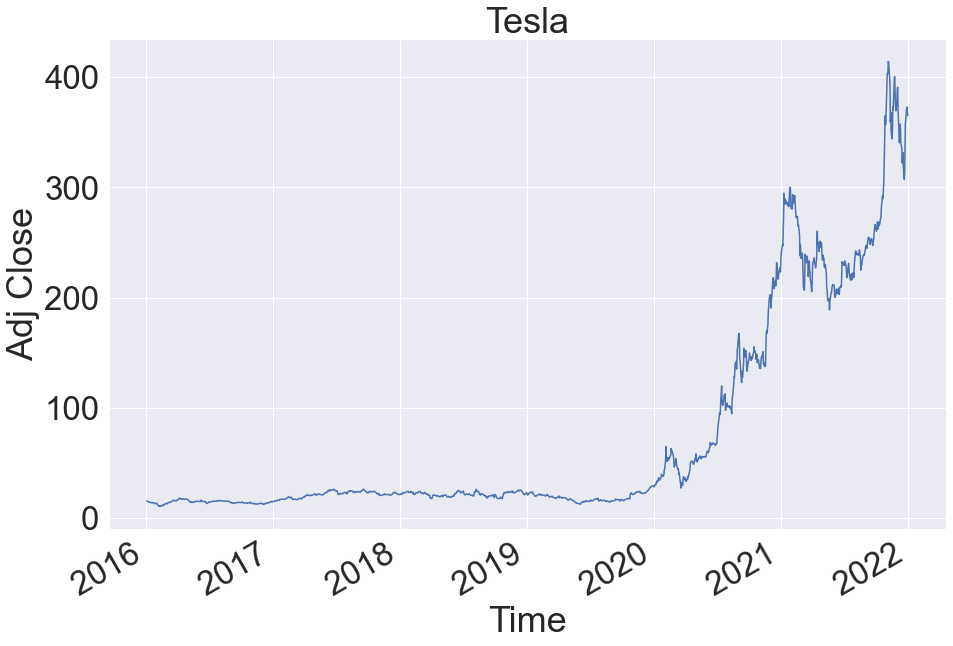
data['High'].plot()
plt.xlabel('Time')
plt.ylabel('Adj Close')
plt.title('Tesla')
Text(0.5, 1.0, 'Tesla')

#Select frequency based on no of observations that comprise a cycle in the dataset
ts_decompose_add = seasonal_decompose(x=data['High'],
                                          model='additive',
                                          freq=180)
estimated_trend_add = ts_decompose_add.trend
estimated_seasonal_add = ts_decompose_add.seasonal
estimated_residual_add = ts_decompose_add.resid
<ipython-input-15-ada5a077c2aa>:2: FutureWarning: the 'freq'' keyword is deprecated, use 'period' instead
  ts_decompose_add = seasonal_decompose(x=data['High'],
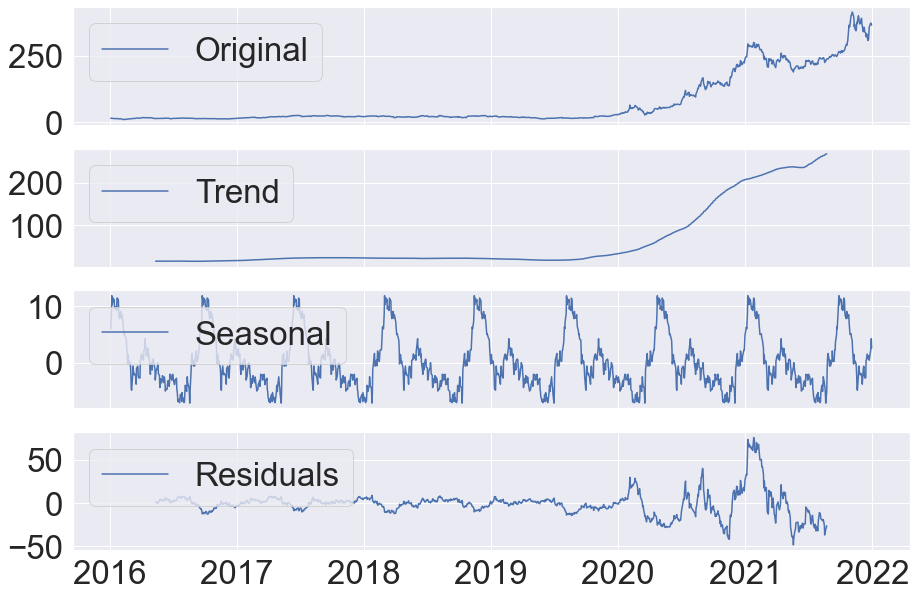
fig, axes = plt.subplots(4, 1, sharex=True, sharey=False)
# fig.set_figheight(10)
# fig.set_figwidth(15)

axes[0].plot(data['High'], label='Original')
axes[0].legend(loc='upper left');

axes[1].plot(estimated_trend_add, label='Trend')
axes[1].legend(loc='upper left');

axes[2].plot(estimated_seasonal_add, label='Seasonal')
axes[2].legend(loc='upper left');

axes[3].plot(estimated_residual_add, label='Residuals')
axes[3].legend(loc='upper left');


